Real-Time Route Profitability Dashboard for a UK 3PL Operator
A real-time BI solution that helps a UK 3PL operator understand route and client profitability by bringing operational, fuel, and billing data into one reporting environment.
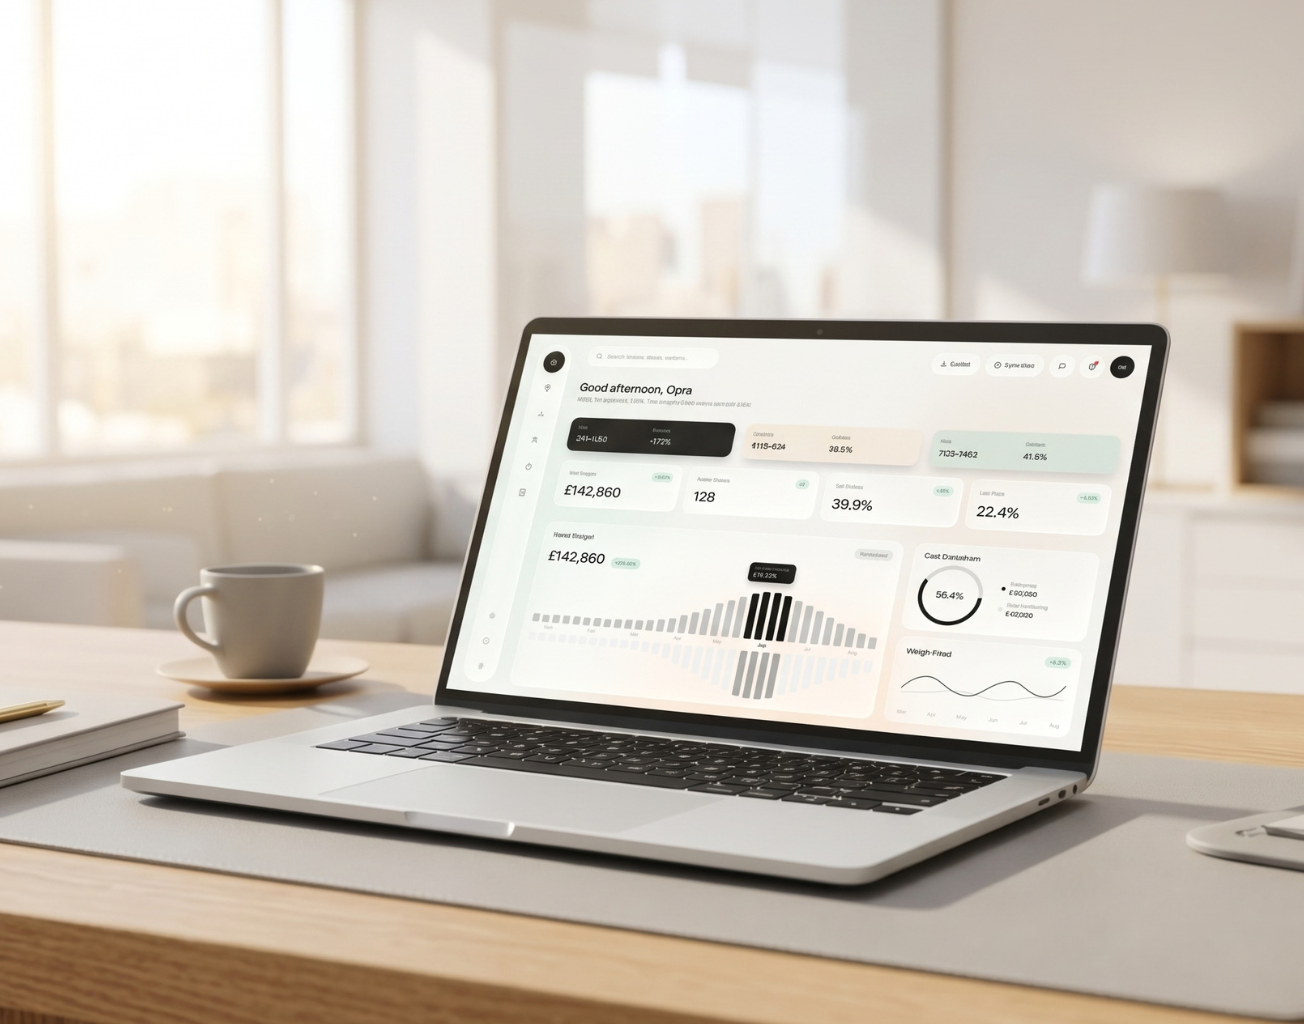
The dashboard shows profitability by individual route, helping the team identify which routes generate healthy margins and which require attention.
Client billing data is combined with operational and cost data to track profitability across client relationships.
Use current margin data to identify pricing gaps and adjust rates without waiting for month-end reporting.
The Idea Behind the Project
The client came to us with a manual profitability reporting process. Every month, the owner had to combine data from the TMS, fuel cost records, and client invoices in Excel to understand which routes and clients were profitable.
Because the reporting cycle could take up to 30 days, pricing decisions were often based on outdated margin data. We helped replace this process with a centralized BI solution that gives the owner timely access to the information needed for day-to-day pricing and operational decisions.
Project Challenges
The client needed to make route profitability easier to analyze while reducing the dependency on manual reporting.
Main challenges:
- Operational, fuel, and billing data was stored across three separate systems.
- Profitability analysis depended on monthly Excel consolidation.
- Route-level margin changes could remain unnoticed until the end of the reporting cycle.
- Pricing decisions lacked timely information about current costs and margins.
- The existing process required recurring manual work from the business owner.

Provided Solutions
Multi-Source Data Integration
We connected the TMS, fuel cost records, and client billing system and established a unified data flow between the three sources.

Profitability Model
We structured the underlying data and defined the metrics required to calculate route- and client-level margins.

BI Reporting Environment
We developed an interactive reporting environment where the owner could analyze profitability across routes and clients and drill down into the underlying figures.

Access & Data Configuration
We configured user access and reporting views around the client's operational workflow and pricing requirements.

Validation & Refinement
We compared the new calculations with existing reports and refined the metrics and views based on feedback from the client.

Key Features Overview
Route-Level Margin
Profitability can be reviewed for individual routes, making it easier to spot margin differences across the network.
Client-Level Analysis
The reporting model connects revenue and associated costs to individual clients for account-level profitability analysis.
Fuel Cost Allocation
Fuel expenses are incorporated into route calculations to account for one of the key variable costs in freight operations.
TMS Data Integration
Operational information from the TMS is connected with financial data to support a more complete profitability calculation.
Margin Trends
Historical and current figures can be compared to identify changes in route and client performance.
Pricing Support
Current profitability figures provide the owner with relevant data when reviewing or adjusting pricing.