Real-Time Financial & Transaction Dashboard for a US Fintech Company
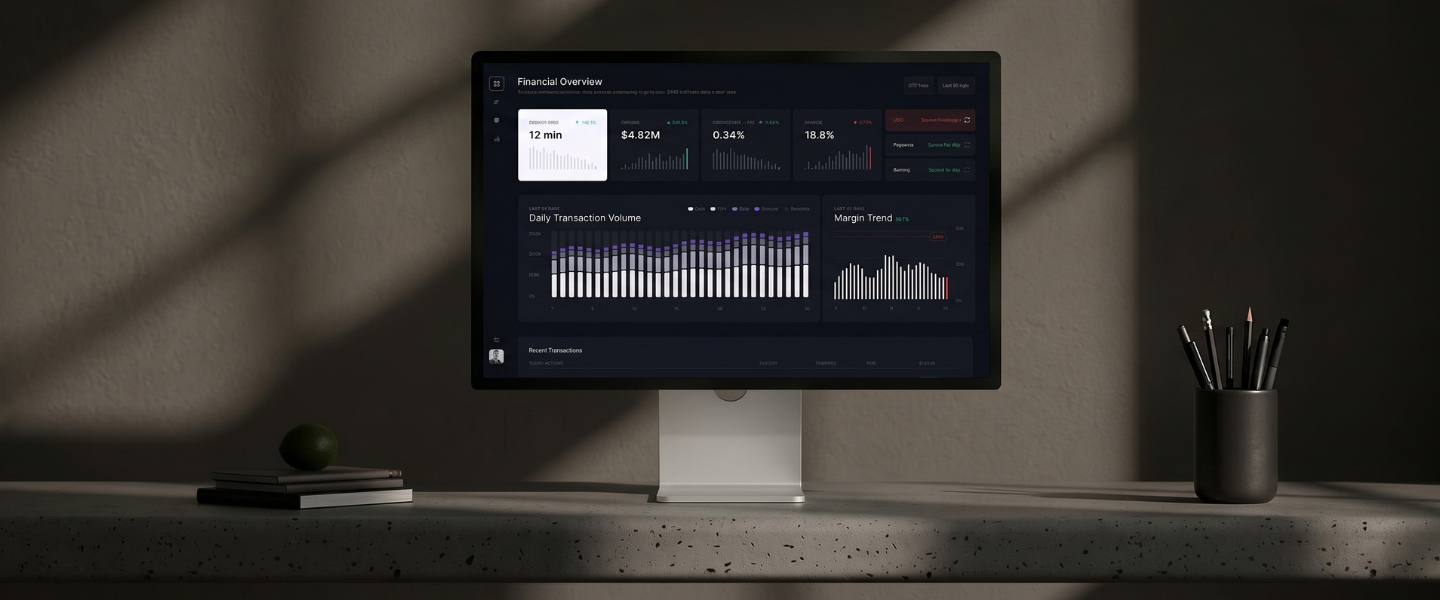
A real-time dashboard that brings data from a payment processor, CRM, and banking system into one view, giving the finance team instant visibility into transaction volumes, chargebacks, and margins.
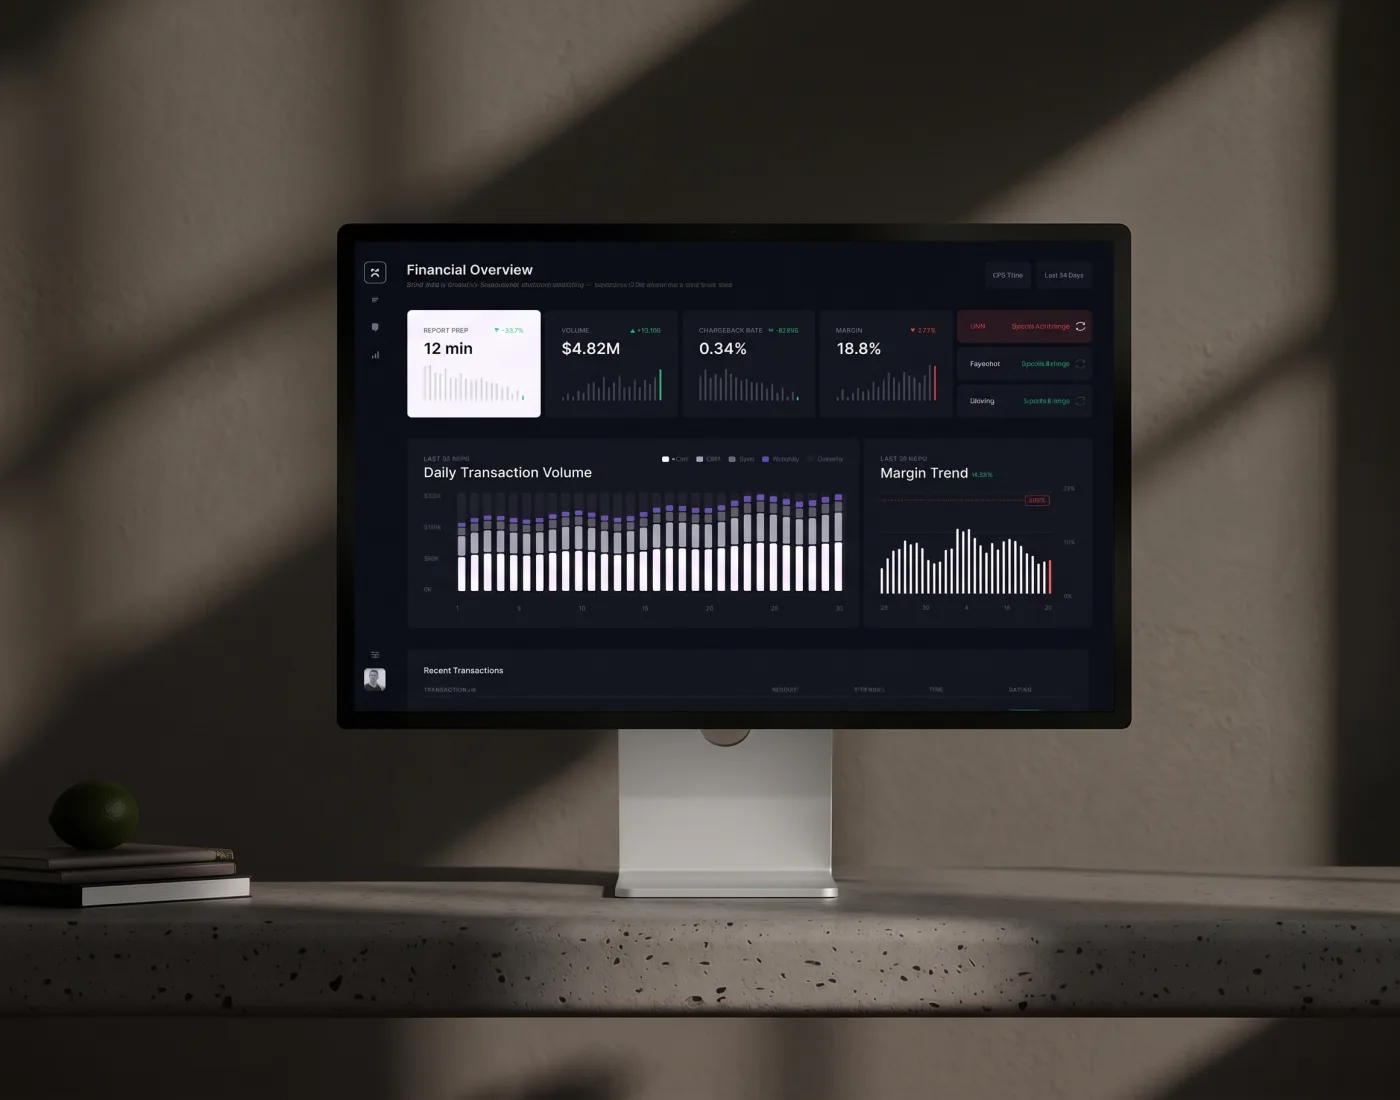
Data from three financial systems is consolidated into one centralized reporting environment.
Live transaction, chargeback, and margin data gives the finance team an up-to-date view of business performance.
Secure access controls allow different stakeholders to view the financial data relevant to their roles.
The Idea Behind the Project
The client came to us with a fragmented financial reporting process that required the CFO to manually combine data from a payment processor, CRM, and banking system in Excel every month to track transaction volumes, chargeback rates, and margins. Preparing the report took several days, and the data was often outdated by the time the final numbers were available.
We helped replace this manual process with a centralized real-time dashboard that brings the company's key financial and transaction metrics into one place. The solution gives the finance team an up-to-date view of business performance without relying on repeated exports and manual data consolidation.
We built a centralized real-time dashboard that replaced this manual workflow and brought the company's key financial and transaction metrics into one place. The solution gave the finance team access to current financial metrics without waiting for the next reporting cycle and relying on repeated exports and manual data consolidation.
Project Challenges
The client needed to bring data from several disconnected financial systems into one reliable reporting environment while reducing the time required to prepare monthly reports.
Main challenges:
- Financial data was spread across three separate systems with no unified reporting view.
- Monthly reporting required manual exports and Excel consolidation.
- Report preparation took several days.
- Financial metrics were already outdated by the time the report was completed.
- Different stakeholders needed secure access to relevant financial information.
Provided Solutions
Multi-Source Data Integration
We connected the payment processor, CRM, and banking system, creating a unified data flow across three previously disconnected sources.

Real-Time Dashboard Development
We built a centralized dashboard with live visibility into transaction volumes, chargeback rates, and margin metrics.

Metric Validation
We defined the key reporting metrics and validated them against the client's existing manual reports to ensure the dashboard reflected the required financial data accurately.

Role-Based Access
We configured access permissions so the CFO and relevant stakeholders could securely access the financial information relevant to their roles.

Reporting Workflow Automation
We replaced the recurring Excel-based reporting process with an always-current dashboard, reducing monthly report preparation from several days to minutes.

Key Features Overview
Real-Time Financial Dashboard
A centralized dashboard provides a current view of transaction volumes, chargebacks, and margins.
Multi-Source Data Integration
The dashboard combines data from the payment processor, CRM, and banking system in one reporting environment.
Transaction Monitoring
Finance teams can track transaction volumes and monitor changes across the business without waiting for monthly reports.
Chargeback Tracking
Live chargeback rate visibility helps the team identify changes in payment performance as they occur.
Margin Visibility
Margin metrics are available alongside transaction data, providing a current view of financial performance.
Role-Based Access
Secure access controls ensure that financial data is available to the right stakeholders based on their roles.